laser spectroscopy
Lasers with visible light (or at least in that frequency range) can be used to detect hyperfine interactions. In this video you’ll learn how. At the bottom of this page, you find an optional video of a conference presentation about laser spectroscopy.
When the video stops to ask you a question, fill out your answer in this Google form. Don’t alter your answer after you watched the rest of the video. If you have second thoughts about your initial answer, write them in the optional text box of the Google form.
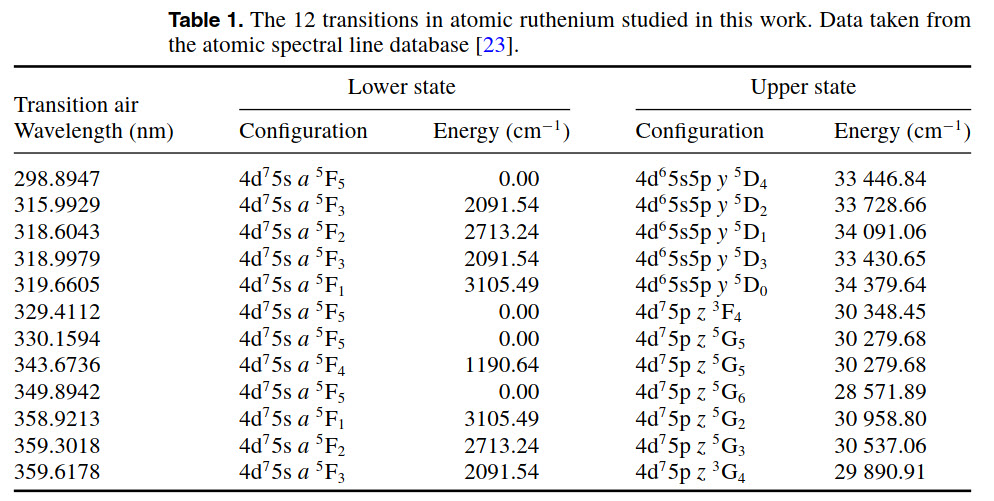
The second task is based on a paper by Forest et al. (J. Phys. G: Nucl. Part. Phys. 41 (2014) 025106). You don’t necessarily have to read the paper (although feel free to do so), we’ll focus on Table 1 that is reproduced underneath. Use the information in this table and the NIST data base to make a neat energy level diagram for Ru with some transitions shown – similarly as shown in the video for Lanthanum. The drawing can be made by hand on paper (scanned to pdf). Upload your drawing via the ‘quiz’ button underneath.

Some useful links:
- the NIST database with atomic spectra information
- help section about the use of the database
- very useful: required notation to start a search in the database
Upload your drawing via this ‘quiz’ button:
Forrest level scheme
Quiz Summary
0 of 1 Questions completed
Questions:
Information
You have already completed the quiz before. Hence you can not start it again.
Quiz is loading…
You must sign in or sign up to start the quiz.
You must first complete the following:
Results
Results
0 of 1 Questions answered correctly
Your time:
Time has elapsed
You have reached 0 of 0 point(s), (0)
Earned Point(s): 0 of 0, (0)
0 Essay(s) Pending (Possible Point(s): 0)
Categories
- Not categorized 0%
-
Your answers have been submitted, thanks for your work. We will discuss these answers in the feedback webinar for this chapter.
- 1
- Current
- Review
- Answered
- Correct
- Incorrect
-
Question 1 of 1
1. Question
Although this web site calls this a ‘quiz’, it is not really one. It’s just a way for you to upload your pdf file with answers. If your file would be too large to upload, use this free online tool to compress it (we recommend to do that anyway).
-
Upload your answer to this question.
This response will be awarded full points automatically, but it can be reviewed and adjusted after submission.
Grading can be reviewed and adjusted.Grading can be reviewed and adjusted. -
As optional material, you can watch this conference talk by G. Farooq-Smith. You’ll get an explanation of laser spectroscopy through the mouth of someone using the method. I bet you have the knowledge now to understand a lot of it! The relevant content is:
- 0m36s – 4m15s : a nice mini-summary of the first part of this course (physics of hyperfine interactions)
- 4m15s – 8m55s : a description of an experimental setup to use laser spectroscopy with radioactive beams
- starting 8m55s : an application to Ga isotopes
Expected time: 60 minutes (report)
B06-02
